DOI:
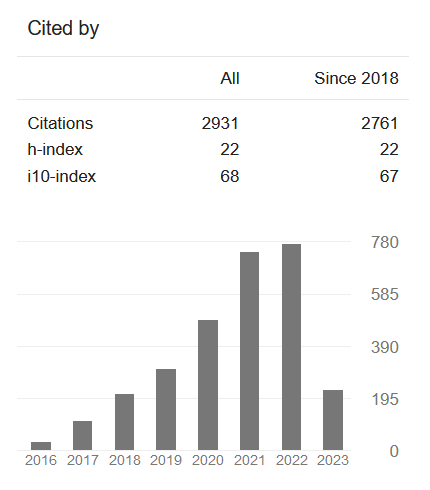
DOI: Google Scholar Analysis
For Authors


ijaems Issue
The Effect of Sample Size On (Cusum and ARIMA) Control Charts( Vol-2,Issue-5,May 2016 ) |
|
Author(s): Dr. Kawa M. Jamal Rashid |
|
Keywords: |
|
|
Cumulative sum CUSUM Chart, ARIMA Control chart, Average Run Length, Distribution-Free Statistical Methods, Manhattan diagram. |
|
Abstract: |
|
|
The purpose of this paper is to study Statistical Process Control (SPC) with a cumulative sum CUSUM chart which shows the total of deviations, of successive samples from the target value and the Average Run Length (ARL) is given quality level is the average number of samples (subgroups) taken before an active signal is given. Sample size has a good effect on the quality chart. The average run length of the cumulative sum control chart is the average number of observations that are entered before the system is declared out of control. Control limits for the new chart are computed from the generalized ARL approximation, The Autocorrelation of the observation increasing by the sample size of the cumulative value distributed by Manhattan diagram. The new chart is compared to other distribution-free procedures using stationary test processes with both normal and abnormal marginal. |
|
Cite This Article: |
|
| Show All (MLA | APA | Chicago | Harvard | IEEE | Bibtex) | |
Share: |
|